
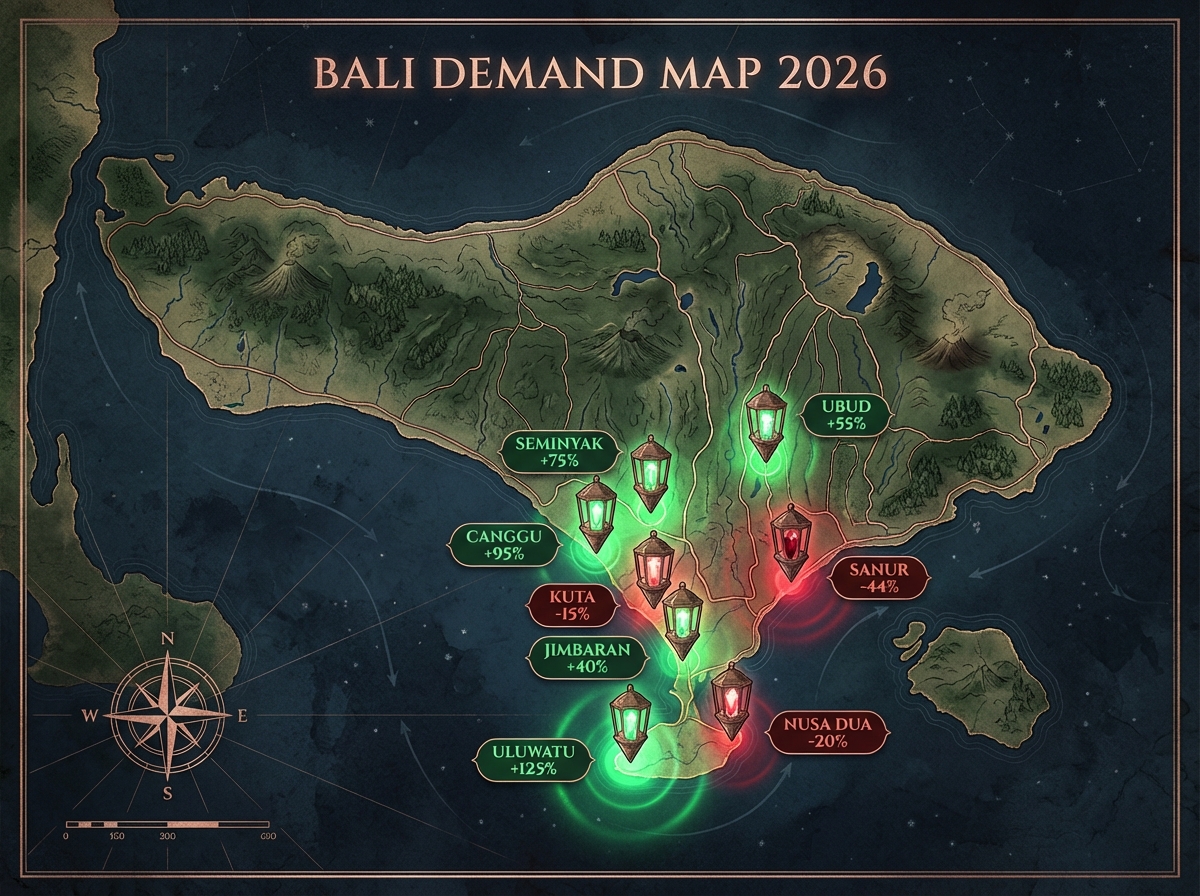
The Complete Bali Market Spectrum
Bali is not one market. It's eight distinct demand zones with radically different pricing dynamics, guest segments, and revenue profiles. Understanding where your property sits on this spectrum is foundational to revenue management.
Our May 2026 analysis of over 150 hotels across Bali's major tourism zones reveals a striking range: from Uluwatu's extreme weekend premium (guests pay 125% more on Saturdays) to Sanur's deep weekend discount (guests pay 44% less on weekends). That's a 169-point spread — far larger than what any seasonal adjustment can explain.
This analysis provides the data framework for three critical decisions: which market to invest in, how to price within your market, and what operator skill set you need to compete.
The 8 Markets Ranked by Weekend Uplift
Weekday ADR: $47 | Weekend ADR: $106 | Type: EXTREME UPLIFT
Uluwatu represents the highest-yield hotel market in Bali. Demand is experience-driven: sunset cliff views, premium villa experiences, and destination dining. Guests book for specific experiences and weekends — they don't arrive mid-week for generic beachside accommodation. The pricing power is absolute: Gatsby's budget villas at $15 midweek ($32 weekend) and Room Padang-Padang at $113 weekday compete at the same market level as Vanara's $197 weekend rate.
Weekday ADR: $26 | Weekend ADR: $35 | Type: DYNAMIC MARKET
Canggu is built on a strong weekday occupancy base (digital nomads, business travelers on longer stays) with weekend leisure spikes. Unlike Uluwatu, weekend demand is incremental occupancy, not premium-paying guests. The market is healthy and consistent, but it's not experience-premium like the cliff markets. Pricing uplift is modest but positive — a 35% increase captures the real demand shift without aggressively overpricing.
Weekday ADR: $38 | Weekend ADR: $43 | Type: WEAK (May cycle)
Kuta shows minimal weekend uplift in May (typically school term in Australia and Europe, which are primary sources). The 13% increase reflects weekend leisure arrivals but is constrained by the market's position as a budget beach destination. May is weak; December-January shows higher uplift.
Weekday ADR: ~$37 | Weekend ADR: ~$42 | Type: LOW-PRESSURE
Lovina shows similar modest uplift to Kuta. This is a lower-pressure market with relaxed occupancy targets and slower travel demand. Weekend pricing increases modestly, but the market isn't venue-competitive — it's more about volume and length of stay.
Weekday ADR: $52 | Weekend ADR: $37 | Type: WEEKDAY-DRIVEN
Seminyak's inverted pricing reflects its core guest composition: European leisure travelers arriving Mon-Thu. These are price-sensitive OTA arrivals; weekend rates are actively counterproductive. Properties trying to apply weekend premiums in Seminyak are systematically losing revenue.
Weekday ADR: $62 | Weekend ADR: $48 | Type: STAY-DRIVEN
Ubud's lower weekend rates reflect the retreat market's arrival pattern: guests arrive Sunday/Monday and stay 4-7 nights. By Saturday, properties are mid-stay. Weekend rate premiums don't generate new arrivals; they just compress the rate on guests already booked. Length-of-stay incentives, not nightly rate optimization, drive Ubud revenue.
Weekday ADR: $156 | Weekend ADR: $97 | Type: PACKAGE-DRIVEN
Nusa Dua's dramatic 38% weekend decline reflects its foundation on tour packages and group bookings. These are booked as multi-day bundles at blended rates, not optimized by individual night. Weekend rate increases actively cannibalize package economics. The high absolute ADR masks this damage until you look at occupancy and length of stay trends.
Weekday ADR: $62 | Weekend ADR: $35 | Type: VOLUME MARKET
Sanur represents the most extreme negative uplift. Guests are mature, longer-stay travelers arriving Friday/Sunday for 7+ night stays. Weekend rate increases push away the only arrivals that matter. This market succeeds on occupancy and customer lifetime value, not nightly rate optimization.
| Rank | Market | Weekday ADR | Weekend ADR | Uplift % | Type |
|---|---|---|---|---|---|
| 1 | Uluwatu | $47 | $106 | +125% | EXTREME |
| 2 | Canggu | $26 | $35 | +35% | DYNAMIC |
| 3 | Kuta | $38 | $43 | +13% | WEAK (May) |
| 4 | Lovina | $37 | $42 | +13% | LOW-PRESSURE |
| 5 | Seminyak | $52 | $37 | -29% | WEEKDAY-DRIVEN |
| 6 | Ubud | $62 | $48 | -23% | STAY-DRIVEN |
| 7 | Nusa Dua | $156 | $97 | -38% | PACKAGE-DRIVEN |
| 8 | Sanur | $62 | $35 | -44% | VOLUME |
Market Classification Framework
These eight markets fall into three distinct archetypes, each with its own revenue strategy and competitive dynamics.
Experience-Premium Markets (Uluwatu)
Demand is driven by the experience itself — cliff sunset views, luxury villas, exclusive properties. Guests book for the experience and are willing to pay premium rates. Weekend demand is incremental and premium-paying.
Occupancy-Balanced Markets (Canggu, Kuta, Lovina)
Weekday occupancy is strong from base demand (digital nomads, local tourism). Weekends add incremental leisure arrivals at modest premium rates. Balanced between occupancy consistency and pricing power.
Occupancy-Driven Markets (Seminyak, Ubud, Nusa Dua, Sanur)
Weekday demand is core; weekends are secondary or cannibalize existing reservations. Revenue is built on occupancy, length of stay, and channel management — not nightly rate optimization.
Investment Framework: Which Market Should You Target?
This data has direct implications for hotel operators and investors deciding where to build, buy, or operate in Bali.
Build Uluwatu if You Have:
Access to premium cliff or view properties, capital for luxury finishes, marketing expertise for experience positioning, and appetite for operational complexity and seasonal volatility. Highest yield; highest risk.
Build Canggu if You Have:
Moderate capital, focus on occupancy consistency, capacity for digital nomad community engagement, and comfort with mid-tier positioning. Balanced profile; lower barrier to entry than Uluwatu.
Build Ubud if You Have:
Operating expertise in retreat partnerships, understanding of wellness positioning, patience with lower nightly rates, and ability to drive length-of-stay bookings through direct channels. Occupancy-focused, requires partnership skills.
Build Sanur if You Have:
Volume operation comfort, ability to serve mature/long-stay travelers, direct booking and repeat customer management, and focus on customer lifetime value over per-night optimization. Stable, lower-pressure, relationship-driven.
Operator Skill Sets by Market
Different markets require different operational excellence.
Uluwatu Operators Need:
Dynamic pricing expertise, luxury brand positioning, crisis management (volatile occupancy), experience design, VIP customer management, seasonal forecasting.
Canggu Operators Need:
Community engagement, social media and lifestyle marketing, OTA channel mastery, consistent occupancy targeting, mid-tier brand positioning.
Ubud Operators Need:
Retreat partnership networks, wellness and experience programming, direct booking and email marketing, length-of-stay incentive architecture, cultural positioning.
Sanur Operators Need:
Repeat customer relationship management, long-term occupancy forecasting, mature traveler engagement, tour operator relationships, customer service excellence.
What This Means for Your Pricing Today
If you operate a hotel in any of these eight markets, your immediate action is to audit whether your current weekend rates match the market type. Operators in experience-premium markets (Uluwatu) should be aggressive. Operators in occupancy-driven markets (Seminyak, Ubud, Nusa Dua, Sanur) should flatten or invert weekend rates.
The competitive advantage isn't in fancy pricing algorithms. It's in understanding where your market sits on this spectrum and setting rates accordingly.
Download the Complete Bali Demand Map
Get live OTA data, monthly trend analysis, and competitive benchmarking for all eight Bali markets. Make data-driven pricing decisions.
Get Complete Market DataUpdated monthly with live Booking.com, Agoda, and Expedia data for 150+ properties.