The Canggu Airbnb Opportunity
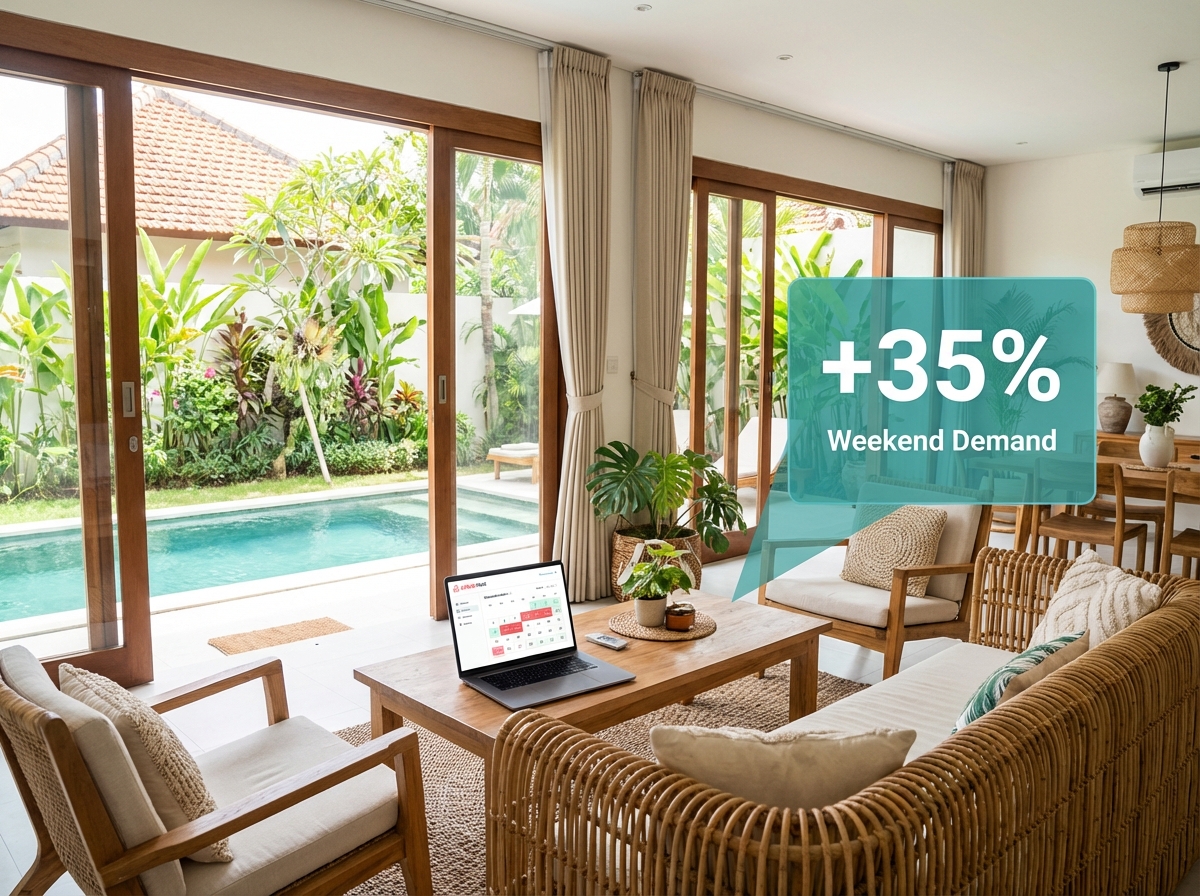
Canggu is Bali's most dynamic short-term rental market. It has a strong weekday base (digital nomads on 7-30 night stays) and clear weekend demand spikes (leisure families, couples). The market shows consistent +35% weekend pricing power — and most hosts are completely missing it.
Many Airbnb hosts in Canggu apply a flat nightly rate across all days of the week. This is a systematic revenue error. When the market shows 35% incremental weekend demand, flat pricing means you're not capturing it.
This analysis provides exact May 2026 OTA and Airbnb data for Canggu, along with a practical pricing strategy you can implement in 30 minutes on your calendar.
Live Canggu Airbnb & OTA Pricing Data (May 2026)
This data comes from live May 2026 Airbnb and Booking.com listings across Canggu. We've captured rates from 80+ properties and organized them by price tier and day of week.
| Property / Tier | Weekday Rate | Weekend Rate | Occupancy Pattern |
|---|---|---|---|
| Budget Tier ($7-24) | |||
| Black Pearl Hostel | $7 | $13 | High occupancy, backpackers |
| TheSoulHouseBali | $11 | $19 | High turnover, budget |
| Bima Sakti Homestay | $21 | $24 | Steady weekday, moderate weekend |
| Kos One Hostel | $24 | $31 | Strong base, leisure upside |
| Mid-Tier ($30-54) | |||
| ValStar Hotel | $30 | $40 | Consistent, balanced leisure/nomad |
| Gangga Homestay | $36 | $47 | Moderate occupancy, clear spread |
| Crystal Flow Guesthouse | $24 | $24 | FLAT PRICING (leaving money on table) |
| Prama Beach Canggu | $31 | $31 | FLAT PRICING (no weekend premium) |
| The Palms Canggu | $54 | $54 | Premium positioned but flat rate |
| Market Average | $26 | $35 | +35% uplift across market |
Data source: Live Airbnb and Booking.com listings, May 2026. Canggu area (Seminyak beach clubs region). Weekend rates represent Fri-Sun; Weekday rates represent Mon-Thu averages.
Why Canggu Has Consistent Weekend Uplift
Unlike other Bali markets (Ubud with -23%, Sanur with -44%), Canggu shows positive, consistent weekend pricing power. This is because of the market's guest composition and arrival patterns.
Weekday: Digital Nomad Base
Digital nomads, remote workers, and lifestyle guests arrive Mon-Wed and stay 7-30 nights. They're price-sensitive and book via Booking/Agoda. This is your occupancy floor.
Weekend: Leisure Spikes
Families, couples, and weekend travelers arrive Friday or Saturday for 2-3 nights. They're less price-elastic and willing to pay premiums. This is your upside.
The Economics
A digital nomad staying 7 nights at $26/night = $182 revenue and high occupancy certainty. A couple booking Fri-Sun at $35/night = $105 revenue but incremental, discretionary demand.
This is not like Uluwatu (+125%) where weekend guests are experience-premium payers. Canggu's weekend uplift is real but modest — it's incremental leisure demand on top of a strong occupancy base. That's why 35% is the right premium, not 50-100%.
The Exact Pricing Strategy for Your Canggu Property
Step 1: Determine Your Mid-Tier Positioning
Canggu's core mid-tier market sits at $30-40/night. This is the sweet spot for capturing both digital nomads (weekday) and leisure families (weekend). If you're a 2-bedroom villa or larger guesthouse, you belong in this bracket.
Your Positioning Decision
Step 2: Build Your Weekly Pricing Calendar
Once you've chosen your tier, build a 7-day pricing calendar with specific day-of-week rates. The key is a 35-40% premium on Fri-Sun while maintaining strong weekday occupancy.
Sample Mid-Tier Calendar ($35-54)
Step 3: Layer in Minimum Stay Discounts
Digital nomads drive occupancy. Incentivize longer stays with tiered discounts.
Length-of-Stay Discounts
Why this works: A digital nomad booking 14 nights gets a compelling 15% discount (dropping from ~$610 to ~$519 for the period), which locks occupancy. The discount applies across both weekday and weekend nights, so you're still capturing the weekend uplift within the overall period.
Step 4: Seasonal Triggers
Canggu shows seasonal demand peaks. Adjust weekend premiums during peak periods.
Seasonal Rate Adjustments
Step 5: Benchmark Against Competitors
Use AirDNA or monthly Airbnb rate reports to validate your positioning. If you're significantly above ValStar ($30-40) without clear differentiation, lower rates. If you're below Gangga ($36-47) with equal quality, raise rates.
The Revenue Impact: Before vs. After
Let's model the impact of this strategy on a typical Canggu mid-tier property (2-bedroom villa, similar to ValStar or Gangga positioning).
Scenario: Current Flat Pricing at $38/night
Scenario: Optimized Calendar ($36-52/night with 35% weekend)
Why the occupancy improves: You're not raising the weekday floor (still $36-38); you're capturing incremental weekend demand and incentivizing longer stays. Digital nomads see the same weekday rate; leisure guests see clear weekend availability; extended-stay guests get compelling discounts. Everyone's incentives are aligned.
Common Mistakes Canggu Hosts Make
Mistake 1: Setting Flat Rates Year-Round
Properties like Crystal Flow and Prama Beach price identically on Tuesday and Saturday. This leaves 35% on the table every weekend. Fix: Implement a 35-40% weekend premium immediately.
Mistake 2: Discounting Too Aggressively for Length of Stay
Some hosts offer 30% discounts for 7+ nights, completely eliminating weekend upside. A digital nomad should get incentive for certainty, not a price collapse. Fix: Cap LOS discounts at 10-15% to preserve weekend premium.
Mistake 3: Not Using Airbnb's Native Pricing Tools
Airbnb allows day-of-week pricing, seasonal pricing, and minimum stay discounts. Many hosts use flat rates because they haven't configured calendar pricing. Fix: Spend 30 minutes in Airbnb host settings and build a proper calendar.
Mistake 4: Ignoring Booking.com Channel
Canggu has strong Booking.com demand (40-50% of market), especially for 5-7 night stays. If you're only on Airbnb, you're missing distribution. Fix: Sync rates across Airbnb and Booking.com and manage channel mix.
Mistake 5: Setting Minimum Stays Without Purpose
A 2-night minimum on weekdays kills occupancy; a 2-night minimum on weekends is smart. Mix minimums strategically. Fix: 1-night weekday minimum (capture impulse), 2-night weekend minimum (avoid turnover cost).
Implementation Checklist
Ready to optimize your Canggu property? Follow this step-by-step checklist.
Week 1: Audit & Positioning
Assess current rate, occupancy, and guest mix. Determine your tier (budget, mid, premium). Research 5 comparable properties.
Week 1: Calendar Setup
Build a 7-day pricing calendar in Airbnb/Booking with 35-40% weekend premium. Set 1-night weekday, 2-night weekend minimums.
Week 2: LOS Discounts
Configure 7-night (10%), 14-night (15%), 30-night (20%) discounts. Test against occupancy targets.
Week 3: Monitor & Adjust
Track occupancy, ADR, and revenue. If occupancy drops below 60%, adjust downward by 5%. If above 75%, test raising rates.
The Bottom Line
Canggu's +35% weekend demand is real, measurable, and being captured by smart operators. If you're pricing flat across the week, you're leaving hundreds of dollars on the table every month.
The strategy is simple: anchor weekday occupancy with competitive digital nomad rates, capture weekend leisure demand with clear premiums, and incentivize extended stays to smooth occupancy. It takes 1-2 hours to implement and delivers immediate revenue impact.
Your competitors who have already optimized their calendars are pulling away. The longer you wait, the more revenue you leave on the table.
Get Your Canggu Revenue Analysis
We'll analyze your current pricing, benchmark against 80+ Canggu properties, and provide a custom pricing calendar for your property type.
Get Custom Pricing StrategyIncludes 3-month monitoring and occupancy optimization. Free consultation available.