
The Fundamental Difference
Uluwatu and Canggu are Bali's two highest-performing tourism markets. But they operate on completely different demand engines, and that difference has profound implications for pricing, operations, and investment returns.
Uluwatu is built on experience premium. Guests arrive because of the cliff villas, sunset views, and exclusive positioning. They book specific experiences and are willing to pay aggressively for them. Weekend demand is incremental and premium-paying. Pricing power is extreme.
Canggu is built on occupancy balance. Weekdays are anchored by digital nomads and longer-stay guests at moderate rates. Weekends add leisure spikes at modest premiums. Revenue comes from consistent occupancy and efficient asset turnover, not nightly rate optimization.
This simple distinction — experience-driven vs. occupancy-driven — cascades into every operational and strategic decision. Let's break down the head-to-head comparison.
Market Data: The Full Picture
Uluwatu: Experience-Premium Extreme
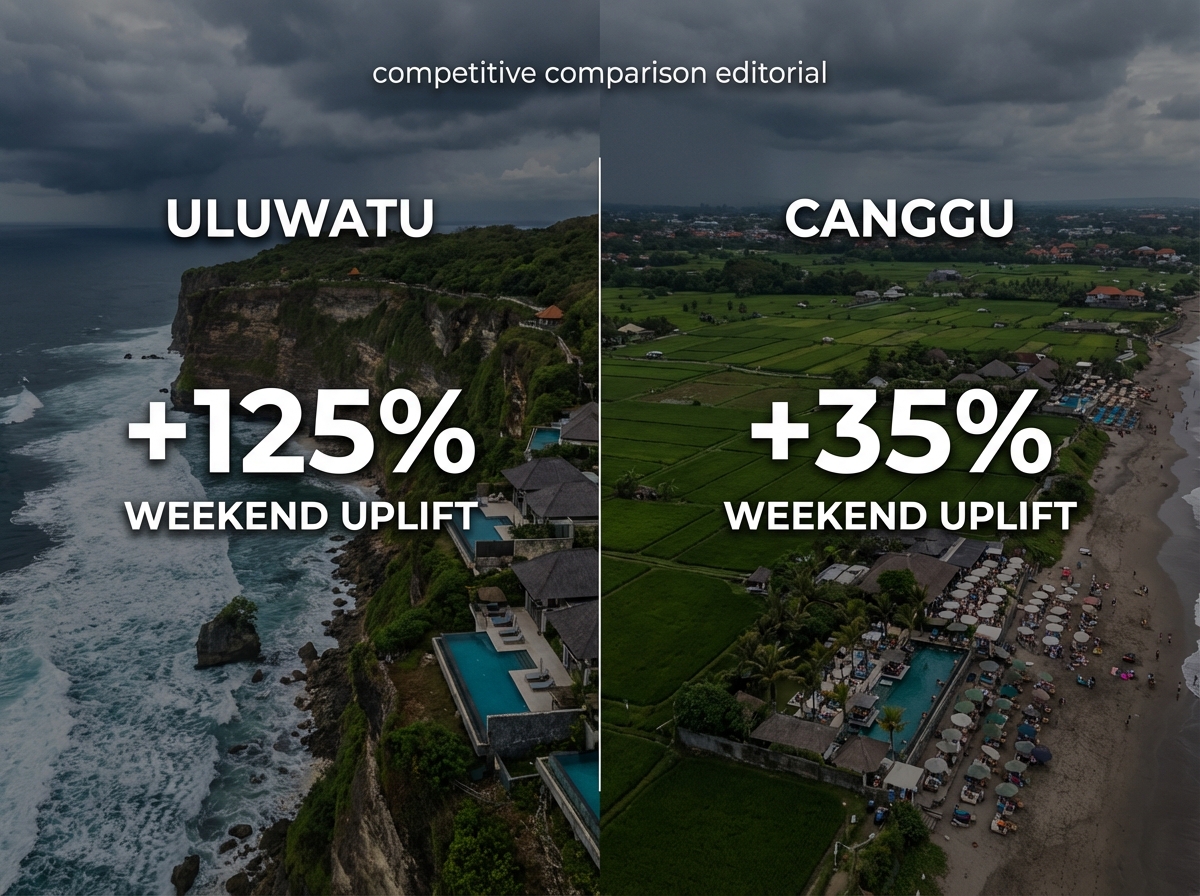
Weekday ADR: $47 | Weekend ADR: $106 | Uplift: +125%
Uluwatu's weekday floor is genuinely low. Budget villas like Gatsby sit at $15 midweek ($32 weekend). Mid-tier properties like Room Padang-Padang hold $113. But what matters is the weekend ceiling: Vanara commands $197 on Saturday. That's not occupancy optimization — that's experience pricing.
The $47 weekday average and $106 weekend average mask massive variance. Uluwatu's pricing range (Gatsby at $15 to Vanara at $197) is the widest in Bali. This spread exists because guests are paying for the experience, not the commodity. A $15 budget villa and a $197 luxury villa both sell on the same weekend, to different guest types, at radically different rates.
This is the hallmark of an experience-premium market: price discrimination works because guests want different things and are willing to pay accordingly.
Canggu: Occupancy Balance with Consistent Positioning
Weekday ADR: $26 | Weekend ADR: $35 | Uplift: +35%
Canggu's weekday base is strong and consistent. Black Pearl Hostel ($7), TheSoulHouseBali ($11), Kos One Hostel ($24), and Bima Sakti Homestay ($21) form an anchor of budget accommodation. The Palms Canggu ($54) is the ceiling for most weekend leisure arrivals. Average stays are 2-4 nights weekday, 2-3 nights weekend.
Unlike Uluwatu, Canggu's pricing doesn't have a wide variance. The market is more homogeneous in positioning. A property at $30-40 (midpoint) is competitive weekday and weekend. The 35% weekend increase is real but not aggressive — it's a modest premium that captures incremental leisure demand without pricing away the occupancy base.
This is occupancy-balanced pricing: stable across the week, with a real but modest weekend premium.
| Metric | Uluwatu | Canggu |
|---|---|---|
| Weekday ADR | $47 | $26 |
| Weekend ADR | $106 | $35 |
| Weekend Uplift | +125% | +35% |
| Weekday Floor | $15 (Gatsby) | $7 (Black Pearl) |
| Weekend Ceiling | $197 (Vanara) | $54 (The Palms) |
| Price Range Spread | $182 (13:1 ratio) | $47 (7.7:1 ratio) |
| Dominant Guest Type | Affluent couples, honeymooners, experience-seekers | Digital nomads (weekday), leisure families (weekend) |
| Booking Channel Mix | Direct (40%), luxury sites (30%), OTA (30%) | OTA (50%), direct (30%), loyalty programs (20%) |
| Typical LOS | 1-3 nights (high turnover) | Weekday 4-7 nights, Weekend 2-3 nights |
Head-to-Head Comparison: 8 Critical Dimensions
1. Average Daily Rate (ADR) Potential
2. Occupancy Consistency
3. Guest Segment Segmentation
4. Seasonal Patterns
5. Channel Dependency
6. Operational Complexity
7. Investment Returns & Risk Profile
8. Competitive Dynamics
Which Should You Build In?
Choose Uluwatu If:
You have access to premium cliff or view property, capital for luxury finishes ($3-5M+), marketing expertise for positioning, comfort with operational complexity, and patience for seasonal volatility. You want maximum absolute revenue. You can execute at highest level.
Choose Canggu If:
You have moderate capital ($1-2M), focus on occupancy consistency, digital marketing skills, ability to engage lifestyle community, and comfort with mid-tier positioning. You want stable, predictable revenue. You have good operations but aren't necessarily at premium level.
The honest answer: Uluwatu returns 2-3x more revenue per available room. But it requires expertise, capital, and market timing. Canggu returns less, but more consistently and predictably. If you're an experienced luxury operator with capital and risk tolerance, Uluwatu is higher return. If you're building a portfolio for stable growth, Canggu's consistency pays compounding dividends.
Pricing Strategy Implications
Uluwatu Pricing Playbook
Set High Weekend Premiums
125% is market-standard. Premium guests expect to pay more on weekends. This isn't demand limitation; it's demand composition.
Maintain Weekday Floor
Keep weekday rates low to fill occupancy with longer-stay guests (digital nomads, workers). Yield comes from weekend premiums.
Use Dynamic Pricing
Real-time inventory management and rate updates are essential. High absolute rates justify complexity.
Segment by Experience
Different villas, different experiences, different prices. Honeymooner villas command 2x budget villa prices. Make this explicit.
Canggu Pricing Playbook
Flatten Weekly Pricing
Keep weekday and weekend within 30-40% spread. Occupancy consistency matters more than nightly rate optimization.
Anchor Weekday Occupancy
Offer 7-night and 30-night discounts to digital nomads. Lock weekday occupancy; weekends are upside.
Optimize OTA Channel Mix
Manage Booking.com and Agoda aggressively (they're your primary channels). Use direct incentives to reduce commission bleed.
Build Community Differentiation
Compete on lifestyle and community, not just price. Social events, coworking, networking. This justifies slightly higher rates.
The Bottom Line
Uluwatu and Canggu represent the two viable paths to high-yield hotel operations in Bali. They're not competing in the same segment — they're competing at different price points, to different guest types, with completely different operational models.
Uluwatu wins on absolute RevPAR. But it requires excellence in execution, capital, and marketing. One bad property or weak season can cripple returns.
Canggu wins on consistency and scalability. Lower margins, but more predictable. Build a portfolio of properties, and the diversification pays.
Neither is "better." They're different bets on what you can execute best.
Get Live Pricing Data for Both Markets
Real-time Booking.com, Agoda, and Expedia data for Uluwatu and Canggu. Make data-driven investment and pricing decisions.
Download Market IntelligenceUpdated daily with competitive benchmarking for 100+ properties across both markets.