
Reviewed by Michael Andrews Hotel Market Intelligence Researcher · 26 May 2026 · 7 min read · RevPARGenius Market Intelligence · Compression event analysis
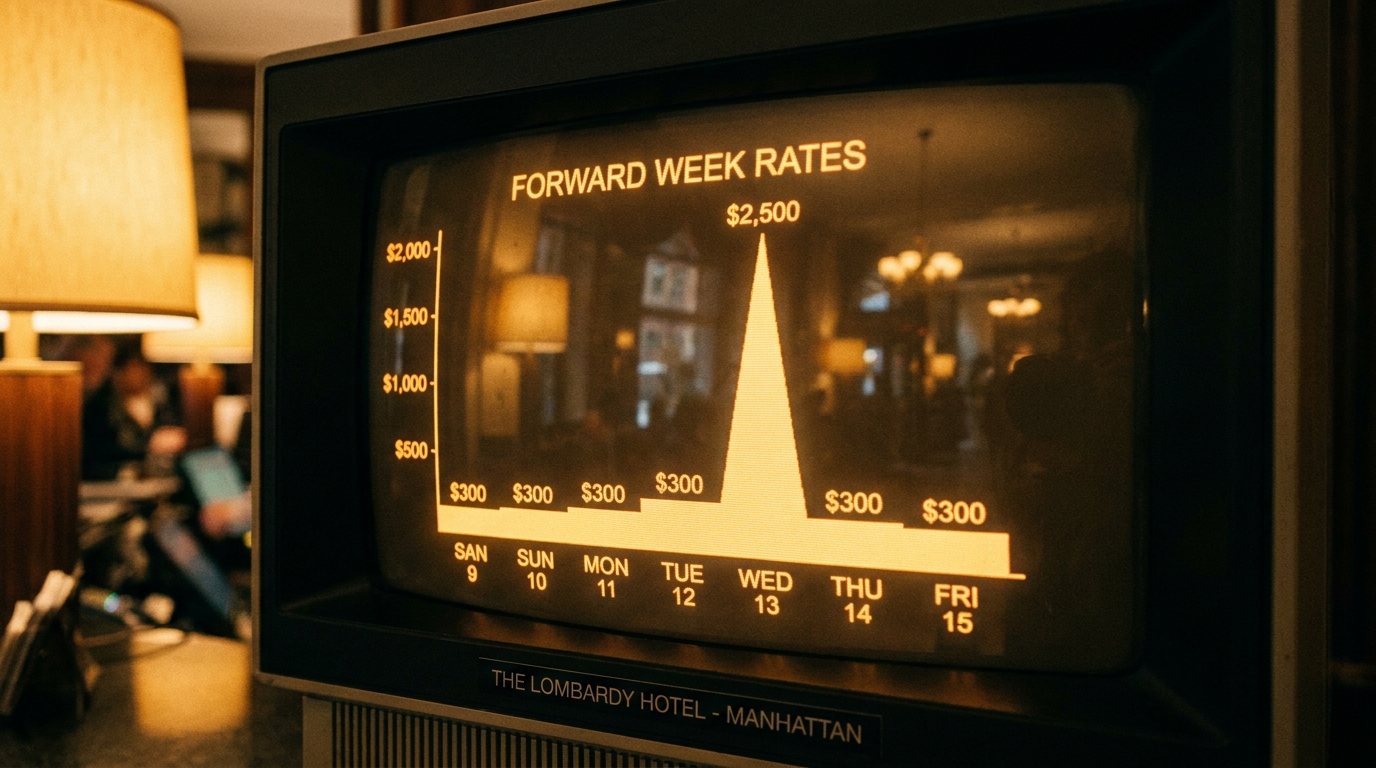
In mid-July 2026, a 90-day Manhattan market scan caught a single weekend where the comp-set Saturday ADR moved +149.1% above the same week's Monday ADR — from $255 weekday to $634 weekend. Two-thirds of independent Manhattan hotels did not react fast enough. The operational discipline that catches a +149% compression spike is forward 14-day rate monitoring with sub-24-hour rate adjustment authority. The cost of missing one spike for a 35-room hotel is approximately $11,690 per weekend; over a year of typical NYC compression events, the gap runs into mid-six figures.
Most weekends in Manhattan move within a predictable +20% to +40% premium over the weekday baseline. That predictability is part of what makes Manhattan a relatively easy market to price — until it isn't.
In the May 2026 scan window, one weekend broke pattern. Across 22 comparable Manhattan hotels, the Saturday-to-Monday ADR jump on Sat Jul 18 – Mon Jul 20 was +149.1% — roughly five times the window's average uplift. The operators who saw it coming captured an extra $10,000–$15,000 per property in that single weekend. The operators who reacted three days late captured 40% of it. The operators who never noticed captured none.
Week 8 compression — the numbers
What causes a +149% weekend compression spike in Manhattan?
Single-weekend spikes above +100% almost always trace to a stacked combination of three or more demand drivers landing on the same dates. In Manhattan in mid-July 2026, the Week 8 spike sits at the intersection of peak summer leisure inflow, late-week concert and entertainment compression at venues including Marquee New York and Madison Square Garden, an unusually warm forecast pulling weekend trips forward, and a thin weekday corporate base that exposes the weekend uplift more sharply against the contrast.
None of those drivers alone produces +149%. Combined, they do. The right operational read is not "what specific event drove this" — it is "the comp set moved together and the forward-week pricing data showed it before the weekend arrived." Operators who watch comp-set pricing 14 days out see the move build; operators who watch only their own historical rate patterns do not.
Why do most independent Manhattan hotels miss compression spikes like this?
Three operational patterns produce the gap consistently.
1. Weekly revenue review cadence
Most independent properties run rate reviews once or twice a week, with substantive rate changes requiring approval and a manual push to the channel manager. Inside that cadence, a +149% spike that builds inside a 7–10 day window is invisible until the spike is half-over. By the time the review happens and rates are pushed, the comp set has already moved and the booking pace is locked in at lower rates.
2. Trailing-data anchoring
Operators anchored to trailing 30-day or 90-day averages cannot see forward variance. The +149% spike is invisible to the trailing average because the spike has not happened yet. Forward 14-day comp-set scanning is the only tooling that catches spikes before they execute — and most independent properties don't have it.
3. Ownership rate approval friction
At properties where rates above a certain ceiling require ownership sign-off, the friction kills the move. By the time the GM has built the case, scheduled the call, gotten approval, and pushed the rate, the window has closed. The operators who consistently capture compression weeks have pre-authorised rate envelopes that the Revenue Manager can execute inside a four-hour window without escalation.
What is the operational discipline that catches a +149% compression week?
Four practices, consistently applied, separate operators who catch compression weeks from those who chase them.
1. Forward 14-day comp-set scanning — daily check of the comp set's forward rates, not just yesterday's. Reveals spikes before they execute.
2. Pre-authorised rate envelope — Revenue Manager has standing authority to move rates within a defined band (typically up to +75% of base) without ownership approval.
3. Sub-24-hour channel push — rate changes propagate to OTAs, GDS and direct channels inside the same business day, not the next morning.
4. Post-compression review — every spike week gets a 15-minute post-mortem to log the trigger, the response timing, and the revenue captured vs available. Builds institutional memory.
What does the revenue math actually look like for a 35-room Manhattan property?
Concrete numbers. A 35-room Manhattan 4-star property running a baseline $300 Saturday rate, facing the Week 8 compression where the comp set moved to $634, has three possible outcomes.
Outcome A — catches it. Forward scanning shows the spike building 10–14 days out. Rates move to $634 on Friday afternoon. Saturday night sells at full compression. Sunday partially holds. Incremental revenue captured: 35 rooms × ($634 - $300) × 1 night = $11,690 over the baseline. Annual pattern: 3–4 compression weeks per year, $35,000–$47,000 incremental annually from compression alone.
Outcome B — partial catch. Sees the spike on Friday morning. Rates push to $450 by Friday afternoon. Captures roughly half the compression. Incremental revenue: approximately $5,250 over baseline. The half not captured is roughly $6,440 in lost contribution — that's the friction cost of slow response.
Outcome C — misses it. Sees the comp-set move after the weekend on Monday morning's review. Rates were held at baseline through the spike. Incremental revenue: zero. Across 3–4 compression weeks annually, the static-pricing operator leaves $35,000–$47,000 on the table — before flow-through. For most independent Manhattan 4-star properties, that figure represents 1.5–2 points of annual gross profit margin.
How does this compression pattern fit into the broader Manhattan market in 2026?
The Week 8 +149% spike was not anomalous in isolation — it was the most extreme example of a market-wide pattern of episodic compression. The same 90-day scan window also recorded a +51.3% Week 5 spike and sustained +33% baseline weekend uplift. The broader Manhattan picture is a flat headline RevPAR (-0.40% YoY) hiding 33.9% combined ADR volatility — a market that rewards forward-looking active pricing and penalises trailing-average pricing.
The 22-property comp set in this scan captured the full pattern. The full Manhattan market scan write-up is here. The compression discipline that catches Week 8 is the same discipline that catches the other 2–4 outlier weeks the year will produce. Build the discipline once; capture the variance every quarter.
RevPARGenius Take
The +149% Manhattan compression week is not an unusual event. The unusual event is having the discipline to catch it.
Every Manhattan operator with comp-set visibility saw the same data. The ones who pre-authorised rate envelopes, ran forward 14-day scanning, and pushed rates inside the same business day captured the revenue. The ones who waited for Monday's review chased a window that had already closed. The technology is not the differentiator — the operational standing orders are.
Frequently asked questions about hotel compression weeks
What is a hotel compression week?
A compression week is a 5-to-7-day window where demand spikes sharply above baseline and the comp set's ADR moves materially higher (typically +35% or more vs the trailing average). Compression weeks are usually event-driven (concerts, sports, conventions, festivals) or seasonality-driven (peak holiday windows). They produce the highest single-week revenue opportunity in a hotel's calendar.
How often do compression weeks occur in Manhattan?
Manhattan typically produces 8–12 weeks per year where weekend uplift exceeds +50% — clustered around peak summer (mid-July to late August), major conventions (March, September, October), holiday windows (Thanksgiving, NYE), and recurring event seasons. The most extreme spikes (above +100%) typically occur 3–5 times annually.
How far in advance should hotels see a compression week building?
Forward 14-day OTA pricing scanning typically reveals compression spikes 10–14 days before they execute. The comp set begins moving rates upward as their forecasting and pickup data signals strong booking pace, and that movement is visible to any operator who pulls the data daily. Operators relying on internal historicals see the spike 0–3 days out — far too late.
What rate-push speed is needed to capture a compression week?
Rate changes need to propagate to all distribution channels (OTAs, direct, GDS) inside the same business day. Operators on weekly channel updates miss most of the spike. Operators on daily updates capture roughly 60–75% of the available compression. Operators on multiple-times-daily updates capture 90%+.
Should I always match the comp set on compression weeks?
Usually yes, with one caveat. If the comp set's spike is being driven by 1–2 properties with unusual constraints (a hotel hosting a private corporate event, a single luxury property with one-off pricing) the spike may not reflect true market demand. The clean read is to remove outliers above 2.5× the median and re-check the spike. If it still holds, match the comp set; if it collapses, hold rates closer to baseline.
Catching compression weeks is the revenue management win. Being visible to travellers who never see your rates is the marketing win — and in 2026 that conversation increasingly happens inside ChatGPT, Perplexity, Gemini and Grok rather than on the OTA results page. The hotels that win on both surfaces compound faster than the hotels that win only on one.
Get your hotel found on AI, SEO, GEO and AEO
See exactly which AI engines name your hotel — and which name your competitor instead.
Hotel AI Visibility runs a live four-engine audit on your property in minutes. ChatGPT, Perplexity, Gemini and Grok. Real prompts. A clear 0–100 score and a list of the actions that will move it — tuned for AI search, SEO, GEO and AEO together.
Test my AI visibility freeSee how the score is calculated
No credit card. First check is free at app.revpargenius.com
Compression analysis based on a May 2026 90-day live OTA scan across 22 Manhattan comp-set properties. Confidence: HIGH (166 matched comps, 12 of 12 weeks reliable). Subject property anonymised pending owner permission. Related reading: the full Manhattan market scan, hotel pricing intelligence, demand analysis vs forecasting. RevPARGenius is an independent hotel market intelligence platform — not affiliated with any OTA, revenue management system, or hotel chain.